Merging of several StationData objects into one
This notebook illustrates to can merge several instances StationData objects into one objects. This merging only works for data from the same station and a typical case is if the data source files for one station are separated into many single files containing only parts of the data (e.g. if the files contain only one year of data).
In the following, the example of the EBAS database is used for illustration. In particular, we will focus on the retrieval of the aerosol light scattering coefficients at 550 nm (scatc550aer in AEROCOM naming convention) for the station Jungfraujoch, located in Germany.
[1]:
import pyaerocom as pya
Initating pyaerocom configuration
Checking database access...
Checking access to: /lustre/storeA
Access to lustre database: True
Init data paths for lustre
Expired time: 0.016 s
Get list of all files containing scattering data for EBAS station Jungfraujoch
[2]:
reader = pya.io.ReadEbas()
data = reader.read(vars_to_retrieve='scatc550aer',
                            datalevel=2, station_names='Jungfraujoch')
print(data)
Retrieving EBAS files for variables
['scatc550aer']
Reading files 1-3 of 28 (ReadEbas) | 18:10:51 (delta = 0 s')
Reading files 3-5 of 28 (ReadEbas) | 18:10:52 (delta = 0 s')
Reading files 5-7 of 28 (ReadEbas) | 18:10:52 (delta = 0 s')
Reading files 7-9 of 28 (ReadEbas) | 18:10:53 (delta = 0 s')
Reading files 9-11 of 28 (ReadEbas) | 18:10:53 (delta = 0 s')
Reading files 11-13 of 28 (ReadEbas) | 18:10:54 (delta = 0 s')
Reading files 13-15 of 28 (ReadEbas) | 18:10:55 (delta = 0 s')
Reading files 15-17 of 28 (ReadEbas) | 18:10:55 (delta = 0 s')
Reading files 17-19 of 28 (ReadEbas) | 18:10:56 (delta = 0 s')
Reading files 19-21 of 28 (ReadEbas) | 18:10:57 (delta = 0 s')
Reading files 21-23 of 28 (ReadEbas) | 18:10:58 (delta = 0 s')
Reading files 23-25 of 28 (ReadEbas) | 18:10:59 (delta = 1 s')
Reading files 25-27 of 28 (ReadEbas) | 18:11:00 (delta = 1 s')
Reading files 27-29 of 28 (ReadEbas) | 18:11:01 (delta = 1 s')
Pyaerocom UngriddedData
-----------------------
Contains networks: ['EBASMC']
Contains variables: ['scatc550aer']
Contains instruments: ['IN3563', 'TSI_3563_JFJ_dry', 'Ecotech_Aurora3000_JFJ_dry']
Total no. of meta-blocks: 28
Filters that were applied:
 Filter time log: 20191003181051
        prefer_statistics: ['arithmetic mean', 'median']
        wavelength_tol_nm: 50
        datalevel: 2
        station_names: Jungfraujoch
 Filter time log: 20191003181102
        Removed 0 metadata blocks that have no data assigned
As you can see, the data has successfully been imported into an instance of the UngriddedData class. This class is organised by file, that is, for each of the 26 files that were imported, there is one metadata dictionary assigned. Let’s look at the metadata from the first file:
[3]:
data.metadata[0]
[3]:
OrderedDict([('latitude', 46.5475),
             ('longitude', 7.985),
             ('altitude', 3578.0),
             ('filename',
              'CH0001G.19950101000000.20181031145000.nephelometer..aerosol.1y.1h.CH02L_IN3563.CH02L_backscat_coef.lev2.nas'),
             ('station_id', 'CH0001G'),
             ('station_name', 'Jungfraujoch'),
             ('instrument_name', 'IN3563'),
             ('PI', 'Baltensperger, Urs; Weingartner, Ernest'),
             ('country', None),
             ('ts_type', 'hourly'),
             ('data_id', 'EBASMC'),
             ('dataset_name', None),
             ('data_product', None),
             ('data_version', None),
             ('data_level', 2),
             ('revision_date', numpy.datetime64('2018-10-31T00:00:00')),
             ('website', None),
             ('ts_type_src', None),
             ('stat_merge_pref_attr', None),
             ('data_revision', '20190701'),
             ('var_info',
              OrderedDict([('scatc550aer',
                            OrderedDict([('name',
                                          'aerosol_light_scattering_coefficient'),
                                         ('units', '1/Mm'),
                                         ('wavelength', '550.0 nm'),
                                         ('method_ref', 'CH02L_scat_coef'),
                                         ('matrix', 'aerosol'),
                                         ('statistics',
                                          'arithmetic mean')]))])),
             ('variables', ['scatc550aer'])])
And the last one:
[4]:
data.metadata[25]
[4]:
OrderedDict([('latitude', 46.5475),
             ('longitude', 7.985),
             ('altitude', 3580.0),
             ('filename',
              'CH0001G.20170101000000.20190524143212.nephelometer..aerosol.1y.1h.CH02L_Ecotech_Aurora3000_JFJ_dry.CH02L_Neph_Aurora3000.lev2.nas'),
             ('station_id', 'CH0001G'),
             ('station_name', 'Jungfraujoch'),
             ('instrument_name', 'Ecotech_Aurora3000_JFJ_dry'),
             ('PI', 'Bukowiecki, Nicolas; Baltensperger, Urs'),
             ('country', None),
             ('ts_type', 'hourly'),
             ('data_id', 'EBASMC'),
             ('dataset_name', None),
             ('data_product', None),
             ('data_version', None),
             ('data_level', 2),
             ('revision_date', numpy.datetime64('2019-05-24T00:00:00')),
             ('website', None),
             ('ts_type_src', None),
             ('stat_merge_pref_attr', None),
             ('data_revision', '20190701'),
             ('var_info',
              OrderedDict([('scatc550aer',
                            OrderedDict([('name',
                                          'aerosol_light_scattering_coefficient'),
                                         ('units', '1/Mm'),
                                         ('wavelength', '525.0 nm'),
                                         ('statistics', 'arithmetic mean'),
                                         ('matrix', 'aerosol')]))])),
             ('variables', ['scatc550aer'])])
As you can see, both files contain scattering data but do not share all the same metadata attributes (e.g. instrument_name is different, which might be due to technological updates over time).
Let’s have a look at the respective time-series for both stations. First, convert into instance of StationData class and then plot.
[5]:
first_file = data.to_station_data(0, vars_to_convert='scatc550aer')
print(first_file)
Pyaerocom StationData
---------------------
var_info (BrowseDict):
  scatc550aer (OrderedDict):
    name: aerosol_light_scattering_coefficient
    units: 1/Mm
    wavelength: 550.0 nm
    method_ref: CH02L_scat_coef
    matrix: aerosol
    statistics: arithmetic mean
    overlap: False
station_coords (dict):
  latitude: 46.5475
  longitude: 7.985
  altitude: 3578.0
data_err (BrowseDict): <empty_dict>
overlap (BrowseDict): <empty_dict>
data_flagged (BrowseDict):
  scatc550aer (ndarray, 8760 items): [1.00, 1.00, ..., 0.0, 0.0]
filename: CH0001G.19950101000000.20181031145000.nephelometer..aerosol.1y.1h.CH02L_IN3563.CH02L_backscat_coef.lev2.nas
station_id: CH0001G
station_name: Jungfraujoch
instrument_name: IN3563
PI: Baltensperger, Urs; Weingartner, Ernest
country: None
ts_type: hourly
latitude: 46.5475
longitude: 7.985
altitude: 3578.0
data_id: EBASMC
dataset_name: None
data_product: None
data_version: None
data_level: 2
revision_date: 2018-10-31T00:00:00
website: None
ts_type_src: hourly
stat_merge_pref_attr: None
data_revision: 20190701

Data arrays
.................
dtime (ndarray, 8760 items): [1995-01-01T00:30:00.000000000, 1995-01-01T01:29:59.000000000, ..., 1995-12-31T22:29:59.000000000, 1995-12-31T23:29:59.000000000]
Pandas Series
.................
scatc550aer (Series, 8760 items)
[6]:
last_file = data.to_station_data(25)
print(last_file)
Pyaerocom StationData
---------------------
var_info (BrowseDict):
  scatc550aer (OrderedDict):
    name: aerosol_light_scattering_coefficient
    units: 1/Mm
    wavelength: 525.0 nm
    statistics: arithmetic mean
    matrix: aerosol
    overlap: False
station_coords (dict):
  latitude: 46.5475
  longitude: 7.985
  altitude: 3580.0
data_err (BrowseDict): <empty_dict>
overlap (BrowseDict): <empty_dict>
data_flagged (BrowseDict):
  scatc550aer (ndarray, 8760 items): [1.00, 1.00, ..., 1.00, 0.0]
filename: CH0001G.20170101000000.20190524143212.nephelometer..aerosol.1y.1h.CH02L_Ecotech_Aurora3000_JFJ_dry.CH02L_Neph_Aurora3000.lev2.nas
station_id: CH0001G
station_name: Jungfraujoch
instrument_name: Ecotech_Aurora3000_JFJ_dry
PI: Bukowiecki, Nicolas; Baltensperger, Urs
country: None
ts_type: hourly
latitude: 46.5475
longitude: 7.985
altitude: 3580.0
data_id: EBASMC
dataset_name: None
data_product: None
data_version: None
data_level: 2
revision_date: 2019-05-24T00:00:00
website: None
ts_type_src: hourly
stat_merge_pref_attr: None
data_revision: 20190701

Data arrays
.................
dtime (ndarray, 8760 items): [2017-01-01T00:30:00.000000000, 2017-01-01T01:29:59.000000000, ..., 2017-12-31T22:29:59.000000000, 2017-12-31T23:29:59.000000000]
Pandas Series
.................
scatc550aer (Series, 8760 items)
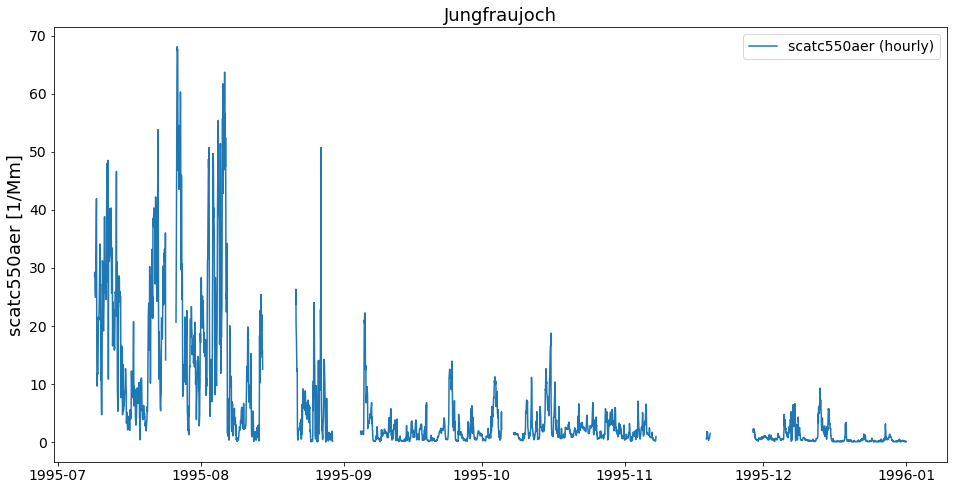
[7]:
first_file.plot_timeseries('scatc550aer');
[8]:
last_file.plot_timeseries('scatc550aer');
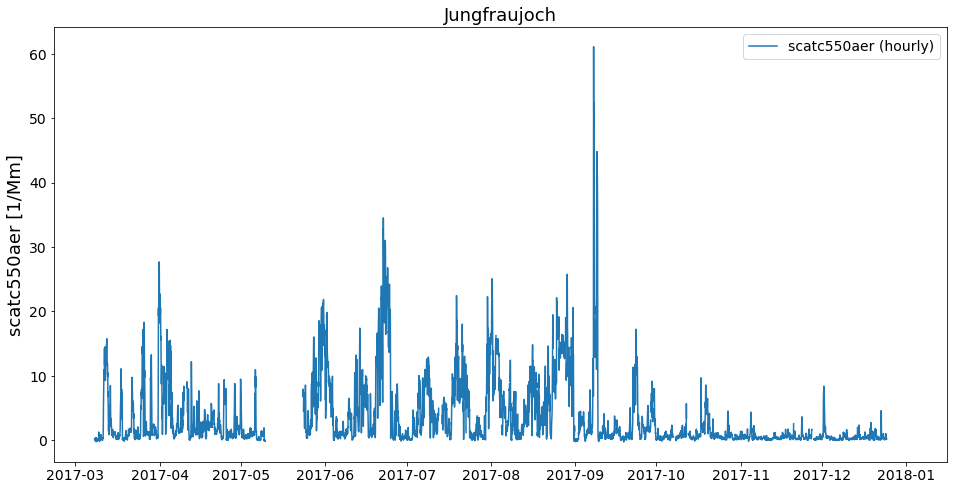
As you can see, the files contain data from different years. Now, how can we get these objects into one object that contains the timeseries of both files from this station?
This is actually very easy:
[9]:
merged = first_file.merge_other(last_file, 'scatc550aer')
print(merged)
Pyaerocom StationData
---------------------
var_info (BrowseDict):
  scatc550aer (OrderedDict):
    name: aerosol_light_scattering_coefficient
    units: 1/Mm
    wavelength: 550.0 nm;525.0 nm
    method_ref: CH02L_scat_coef
    matrix: aerosol
    statistics: arithmetic mean
    overlap: False
    ts_type: hourly
    apply_constraints: False
    min_num_obs: None
station_coords (dict):
  latitude: 46.5475
  longitude: 7.985
  altitude: 3578.0
data_err (BrowseDict): <empty_dict>
overlap (BrowseDict): <empty_dict>
data_flagged (BrowseDict):
  scatc550aer (ndarray, 8760 items): [1.00, 1.00, ..., 0.0, 0.0]
filename: CH0001G.19950101000000.20181031145000.nephelometer..aerosol.1y.1h.CH02L_IN3563.CH02L_backscat_coef.lev2.nas; CH0001G.20170101000000.20190524143212.nephelometer..aerosol.1y.1h.CH02L_Ecotech_Aurora3000_JFJ_dry.CH02L_Neph_Aurora3000.lev2.nas
station_id: CH0001G
station_name: Jungfraujoch
instrument_name: IN3563; Ecotech_Aurora3000_JFJ_dry
PI: Baltensperger, Urs; Weingartner, Ernest; Bukowiecki, Nicolas
country: None
ts_type: hourly
latitude: 46.5475
longitude: 7.985
altitude: 3578.0
data_id: EBASMC
dataset_name: None
data_product: None
data_version: None
data_level: 2
revision_date (list, 2 items): [numpy.datetime64('2018-10-31T00:00:00'), numpy.datetime64('2019-05-24T00:00:00')]
website: None
ts_type_src: hourly
stat_merge_pref_attr: None
data_revision: 20190701

Data arrays
.................
dtime (ndarray, 9794 items): [1995-07-08T23:00:00.000000000, 1995-07-09T00:00:00.000000000, ..., 2017-12-24T19:00:00.000000000, 2017-12-31T23:00:00.000000000]
Pandas Series
.................
scatc550aer (Series, 9794 items)
As you can see in the output, the merging comprises not only the data arrays but also registers any differences in the assoicated metdadata (cf. e.g., sampling wavelength 550 nm vs. 525 nm, instrument name, PI)
Now, have a look at the merged timeseries data.
[10]:
merged.plot_timeseries('scatc550aer');
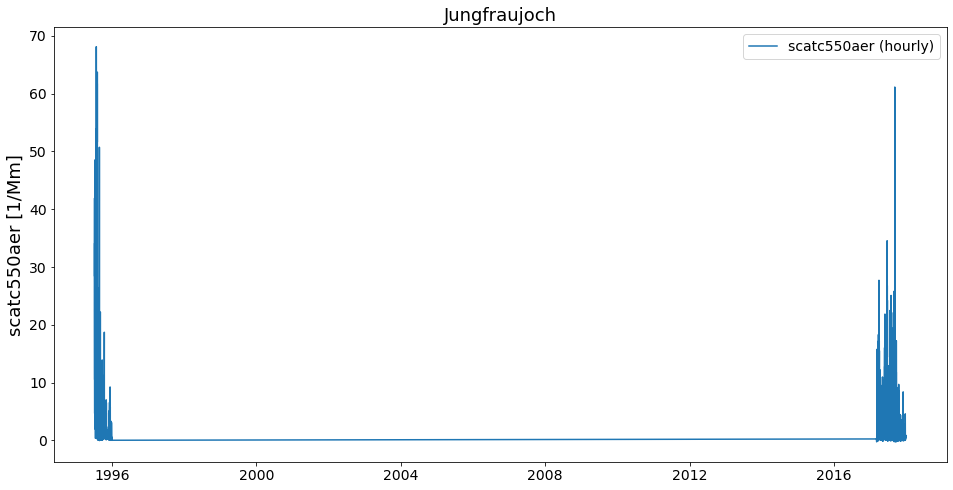
Looks okay. Let’s merge all 26 files and see if we get a nice long time series.
Retrieve list of StationData objects:
[11]:
stats = data.to_station_data('Jungfraujoch', 'scatc550aer', merge_if_multi=False)
print('Number of StationData objects retrieved: {}'.format(len(stats)))
Number of StationData objects retrieved: 28
Now merge them into one long time series:
[12]:
merged = pya.helpers.merge_station_data(stats, var_name='scatc550aer')
print(merged)
Pyaerocom StationData
---------------------
var_info (BrowseDict):
  scatc550aer (OrderedDict):
    name: aerosol_light_scattering_coefficient
    units: 1/Mm
    wavelength: 550.0 nm;525.0 nm
    statistics: arithmetic mean
    matrix: aerosol
    overlap: False
    ts_type: hourly
    apply_constraints: False
    min_num_obs: None
    method_ref: CH02L_scat_coef
station_coords (dict):
  latitude: 46.5475
  longitude: 7.985
  altitude: 3580.0
data_err (BrowseDict): <empty_dict>
overlap (BrowseDict):
  scatc550aer: 2015-01-01 01:00:00    0.255198
2015-01-01 02:00:00   -0.284809
2015-01-01 03:00:00    0.123830
2015-01-01 04:00:00    0.127599
2015-01-01 05:00:00    0.052224
                         ...
2018-12-31 19:00:00   -0.030204
2018-12-31 20:00:00    0.625988
2018-12-31 21:00:00    0.178854
2018-12-31 22:00:00    0.175893
2018-12-31 23:00:00    0.329280
Length: 25787, dtype: float64
data_flagged (BrowseDict):
  scatc550aer (ndarray, 8760 items): [0.0, 0.0, ..., 0.0, 0.0]
filename: CH0001G.20010101000000.20190524142901.nephelometer..aerosol.1y.1h.CH02L_TSI_3563_JFJ_dry.CH02L_Neph_3563.lev2.nas; CH0001G.20100101000000.20190524142901.nephelometer..aerosol.1y.1h.CH02L_TSI_3563_JFJ_dry.CH02L_Neph_3563.lev2.nas; CH0001G.20060101000000.20190524142901.nephelometer..aerosol.1y.1h.CH02L_TSI_3563_JFJ_dry.CH02L_Neph_3563.lev2.nas; CH0001G.20180101000000.20190520125514.nephelometer..aerosol.1y.1h.CH02L_Ecotech_Aurora3000_JFJ_dry.CH02L_Neph_Aurora3000.lev2.nas; CH0001G.20040101000000.20190524142901.nephelometer..aerosol.1y.1h.CH02L_TSI_3563_JFJ_dry.CH02L_Neph_3563.lev2.nas; CH0001G.20180101000000.20190520124723.nephelometer..aerosol.1y.1h.CH02L_TSI_3563_JFJ_dry.CH02L_Neph_3563.lev2.nas; CH0001G.20080101000000.20190524142901.nephelometer..aerosol.1y.1h.CH02L_TSI_3563_JFJ_dry.CH02L_Neph_3563.lev2.nas; CH0001G.20050101000000.20190524142901.nephelometer..aerosol.1y.1h.CH02L_TSI_3563_JFJ_dry.CH02L_Neph_3563.lev2.nas; CH0001G.20070101000000.20190524142901.nephelometer..aerosol.1y.1h.CH02L_TSI_3563_JFJ_dry.CH02L_Neph_3563.lev2.nas; CH0001G.20110101000000.20190524142901.nephelometer..aerosol.1y.1h.CH02L_TSI_3563_JFJ_dry.CH02L_Neph_3563.lev2.nas; CH0001G.20030101000000.20190524142901.nephelometer..aerosol.1y.1h.CH02L_TSI_3563_JFJ_dry.CH02L_Neph_3563.lev2.nas; CH0001G.20150101000000.20190524143212.nephelometer..aerosol.1y.1h.CH02L_Ecotech_Aurora3000_JFJ_dry.CH02L_Neph_Aurora3000.lev2.nas; CH0001G.20170101000000.20190524142901.nephelometer..aerosol.1y.1h.CH02L_TSI_3563_JFJ_dry.CH02L_Neph_3563.lev2.nas; CH0001G.20160101000000.20190524142901.nephelometer..aerosol.1y.1h.CH02L_TSI_3563_JFJ_dry.CH02L_Neph_3563.lev2.nas; CH0001G.20000101000000.20181031145000.nephelometer..aerosol.1y.1h.CH02L_IN3563.CH02L_backscat_coef.lev2.nas; CH0001G.20140101000000.20190524142901.nephelometer..aerosol.1y.1h.CH02L_TSI_3563_JFJ_dry.CH02L_Neph_3563.lev2.nas; CH0001G.20020101000000.20190524142901.nephelometer..aerosol.1y.1h.CH02L_TSI_3563_JFJ_dry.CH02L_Neph_3563.lev2.nas; CH0001G.20090101000000.20190524142901.nephelometer..aerosol.1y.1h.CH02L_TSI_3563_JFJ_dry.CH02L_Neph_3563.lev2.nas; CH0001G.20120101000000.20190524142901.nephelometer..aerosol.1y.1h.CH02L_TSI_3563_JFJ_dry.CH02L_Neph_3563.lev2.nas; CH0001G.20130101000000.20190524142901.nephelometer..aerosol.1y.1h.CH02L_TSI_3563_JFJ_dry.CH02L_Neph_3563.lev2.nas; CH0001G.19980101000000.20181031145000.nephelometer..aerosol.1y.1h.CH02L_IN3563.CH02L_backscat_coef.lev2.nas; CH0001G.19960101000000.20181031145000.nephelometer..aerosol.1y.1h.CH02L_IN3563.CH02L_backscat_coef.lev2.nas; CH0001G.20170101000000.20190524143212.nephelometer..aerosol.1y.1h.CH02L_Ecotech_Aurora3000_JFJ_dry.CH02L_Neph_Aurora3000.lev2.nas; CH0001G.19990101000000.20181031145000.nephelometer..aerosol.1y.1h.CH02L_IN3563.CH02L_backscat_coef.lev2.nas; CH0001G.20150101000000.20190524142901.nephelometer..aerosol.1y.1h.CH02L_TSI_3563_JFJ_dry.CH02L_Neph_3563.lev2.nas; CH0001G.20160101000000.20190524143212.nephelometer..aerosol.1y.1h.CH02L_Ecotech_Aurora3000_JFJ_dry.CH02L_Neph_Aurora3000.lev2.nas; CH0001G.19970101000000.20181031145000.nephelometer..aerosol.1y.1h.CH02L_IN3563.CH02L_backscat_coef.lev2.nas; CH0001G.19950101000000.20181031145000.nephelometer..aerosol.1y.1h.CH02L_IN3563.CH02L_backscat_coef.lev2.nas
station_id: CH0001G
station_name: Jungfraujoch
instrument_name: TSI_3563_JFJ_dry; Ecotech_Aurora3000_JFJ_dry; IN3563
PI: Baltensperger, Urs; Weingartner, Ernest; Bukowiecki, Nicolas
country: None
ts_type: hourly
latitude: 46.5475
longitude: 7.985
altitude: 3580.0
data_id: EBASMC
dataset_name: None
data_product: None
data_version: None
data_level: 2
revision_date (list, 3 items): [numpy.datetime64('2019-05-24T00:00:00'), numpy.datetime64('2019-05-20T00:00:00'), numpy.datetime64('2018-10-31T00:00:00')]
website: None
ts_type_src: hourly
stat_merge_pref_attr: None
data_revision: 20190701

Data arrays
.................
dtime (ndarray, 205849 items): [1995-07-08T23:00:00.000000000, 1995-07-09T00:00:00.000000000, ..., 2018-12-31T22:00:00.000000000, 2018-12-31T23:00:00.000000000]
Pandas Series
.................
scatc550aer (Series, 205849 items)
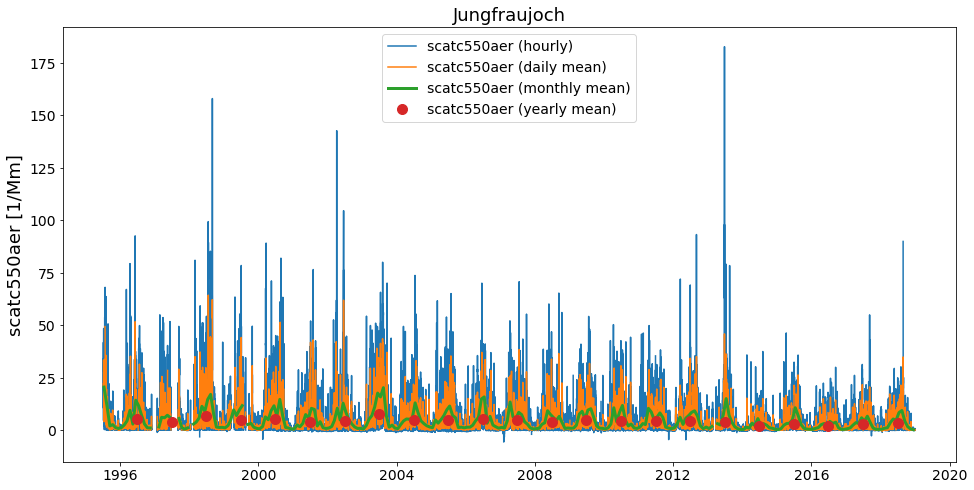
And plot…
[13]:
ax = merged.plot_timeseries('scatc550aer')
merged.plot_timeseries('scatc550aer', freq='daily', ax=ax)
merged.plot_timeseries('scatc550aer', freq='monthly', lw=3, ax=ax)
merged.plot_timeseries('scatc550aer', freq='yearly', ls='none', marker='o', ms=10, ax=ax);
Comment for convenience….
Actually, in the default setup you do not really need to think about all this. As you might have recognised, when creating the list of StationData objects from the UngriddedData object (using method to_station_data) we parsed the argument merge_if_multi=False.
The default here is True, so you can just go ahead and do:
[14]:
data.to_station_data('Jungfraujoch', 'scatc550aer').plot_timeseries('scatc550aer')
[14]:
<matplotlib.axes._subplots.AxesSubplot at 0x7f9d348975f8>
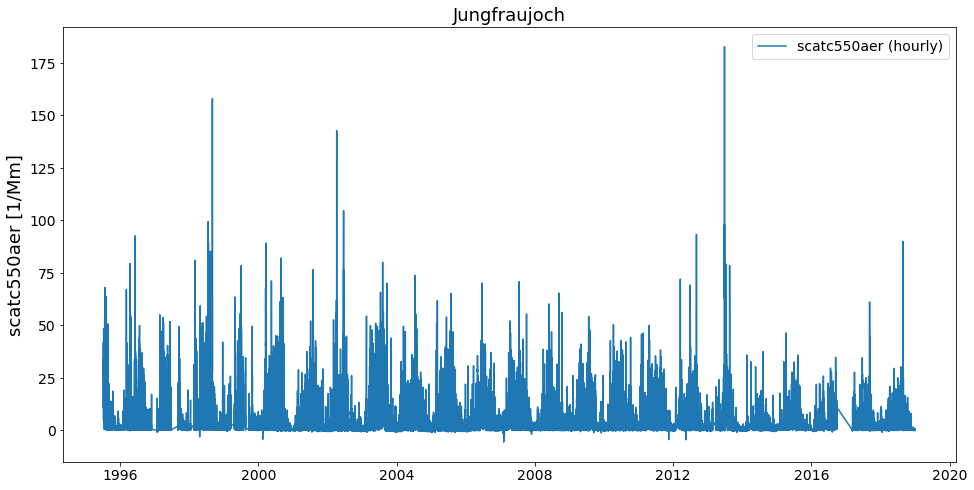
What’s happening here is, that to_station_data internally creates a list of StationData objects and uses the above illustrated method merge_station_data at the end if the input argument merge_if_multi=True.
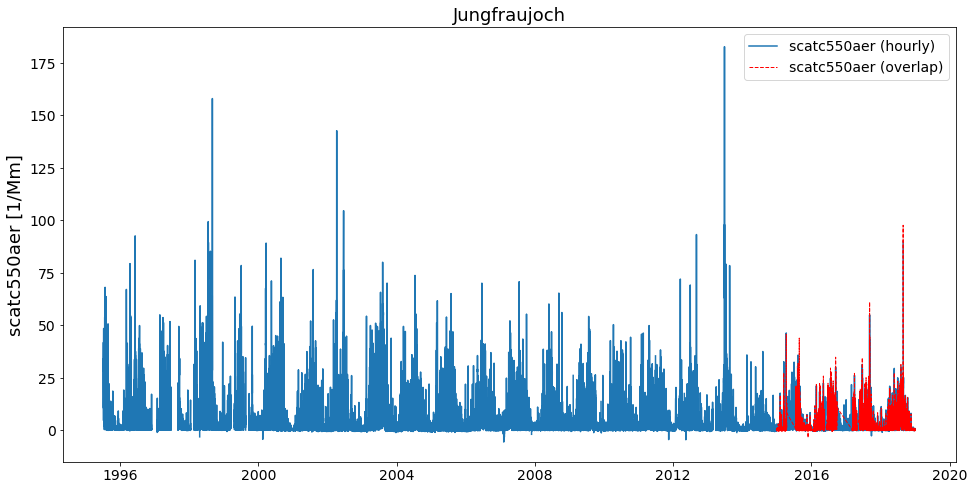
What about overlapping data ??
In some situations, there may be overlapping conflicts when merging multiple time series into one long time-series. In the following, we illustrate how these overlaps are handled if they occur.
The method merge_station_data that is illustrated above has some features to handle overlapping data and in any case, all overlaps that were detected are stored in the overlap attribute of the merged StationData object. Let’s check first if there are any overlaps in the Jungfraujoch data:
[15]:
merged.overlap
[15]:
BrowseDict([('scatc550aer', 2015-01-01 01:00:00    0.255198
             2015-01-01 02:00:00   -0.284809
             2015-01-01 03:00:00    0.123830
             2015-01-01 04:00:00    0.127599
             2015-01-01 05:00:00    0.052224
                                      ...
             2018-12-31 19:00:00   -0.030204
             2018-12-31 20:00:00    0.625988
             2018-12-31 21:00:00    0.178854
             2018-12-31 22:00:00    0.175893
             2018-12-31 23:00:00    0.329280
             Length: 25787, dtype: float64)])
Apparently, there is. You can check out these data (in comparison with the retrieved time series) as follows:
[16]:
merged.plot_timeseries('scatc550aer', add_overlaps=True);
How to prioritise certain stations from others, when deciding what goes into overlap and what into the final timeseries?
The method merge_station_data provides a bunch of options to handle that. Things do not be written twice so please read the docstring of the method:
[17]:
help(pya.helpers.merge_station_data)
Help on function merge_station_data in module pyaerocom.helpers:

merge_station_data(stats, var_name, pref_attr=None, sort_by_largest=True, fill_missing_nan=True, **add_meta_keys)
    Merge multiple StationData objects (from one station) into one instance

    Note
    ----
    - all input :class:`StationData` objects need to have same attributes       ``station_name``, ``latitude``, ``longitude`` and ``altitude``

    Parameters
    ----------
    stats : list
        list containing :class:`StationData` objects (note: all of these
        objects must contain variable data for the specified input variable)
    var_name : str
        data variable name that is to be merged
    pref_attr
        optional argument that may be used to specify a metadata attribute
        that is available in all input :class:`StationData` objects and that
        is used to order the input stations by relevance. The associated values
        of this attribute need to be sortable (e.g. revision_date). This is
        only relevant in case overlaps occur. If unspecified the relevance of
        the stations is sorted based on the length of the associated data
        arrays.
    sort_by_largest : bool
        if True, the result from the sorting is inverted. E.g. if
        ``pref_attr`` is unspecified, then the stations will be sorted based on
        the length of the data vectors, starting with the shortest, ending with
        the longest. This sorting result will then be inverted, if
        ``sort_by_largest=True``, so that the longest time series get's highest
        importance. If, e.g. ``pref_attr='revision_date'``, then the stations
        are sorted by the associated revision date value, starting with the
        earliest, ending with the latest (which will also be inverted if
        this argument is set to True)
    fill_missing_nan : bool
        if True, the resulting time series is filled with NaNs. NOTE: this
        requires that information about the temporal resolution (ts_type) of
        the data is available in each of the StationData objects.
In particular, pref_attr and sort_by_largest are relevant here.
NOTE: if pref_attr is unspecified, then the stations are sorted based on the number of valid measurement points for the input variable. This was done in the merged time series that we retrieved above.
Now, in the following, let’s not use the number of available data points (to sort the stations by relevance) but prefer stations that have a more recent data revision date.
[18]:
try:
    merged_pref_awesomeness = pya.helpers.merge_station_data(stats, 'scatc550aer', pref_attr='awesomeness')
except pya.exceptions.MetaDataError as e:
    print('Failed merging, error: {}'.format(repr(e)))
Failed merging, error: MetaDataError('Cannot sort station relevance by attribute awesomeness. At least one of the input stations does not contain this attribute')
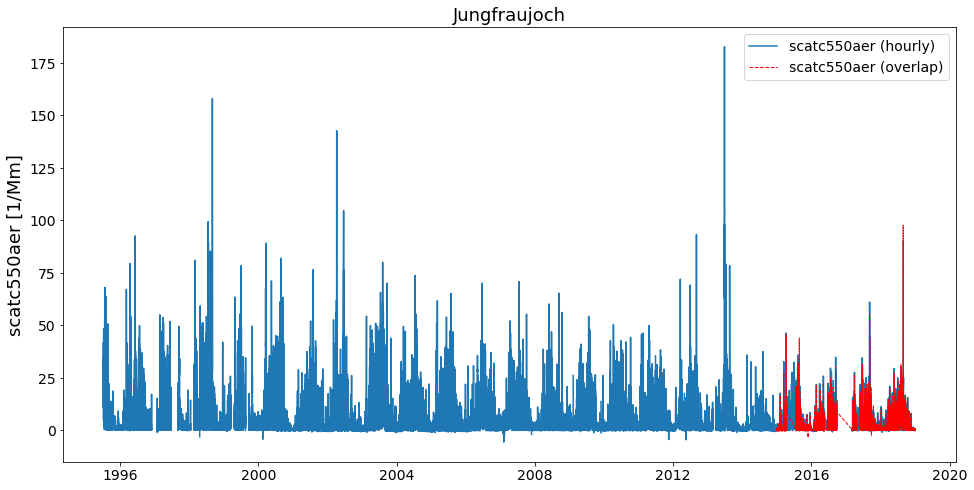
Unfortunately, the StationData objects do not contain an attribute awesomeness by which we could sort. Let’s go with revision_date instead:
[19]:
# recompute stations, since we overwrote one above
stats = data.to_station_data('Jungfraujoch', 'scatc550aer', merge_if_multi=False)
merged_pref_recent_revision = pya.helpers.merge_station_data(stats, 'scatc550aer', pref_attr='revision_date')
[20]:
merged_pref_recent_revision.plot_timeseries('scatc550aer', add_overlaps=True)
[20]:
<matplotlib.axes._subplots.AxesSubplot at 0x7f9d341f8d68>
Let’s see if there is any difference to the previous method (resample to daily resolution):
[21]:
ax = merged.overlap['scatc550aer'].resample('D').mean().plot(style='x', label='Overlaps (prefer longer timeseries)',
                                                             figsize=(20, 8))

merged_pref_recent_revision.overlap['scatc550aer'].resample('D').mean().plot(style='o',
                                                                             label='Overlaps (prefer more recent)',
                                                                             ax=ax, markerfacecolor='none')
ax.legend();
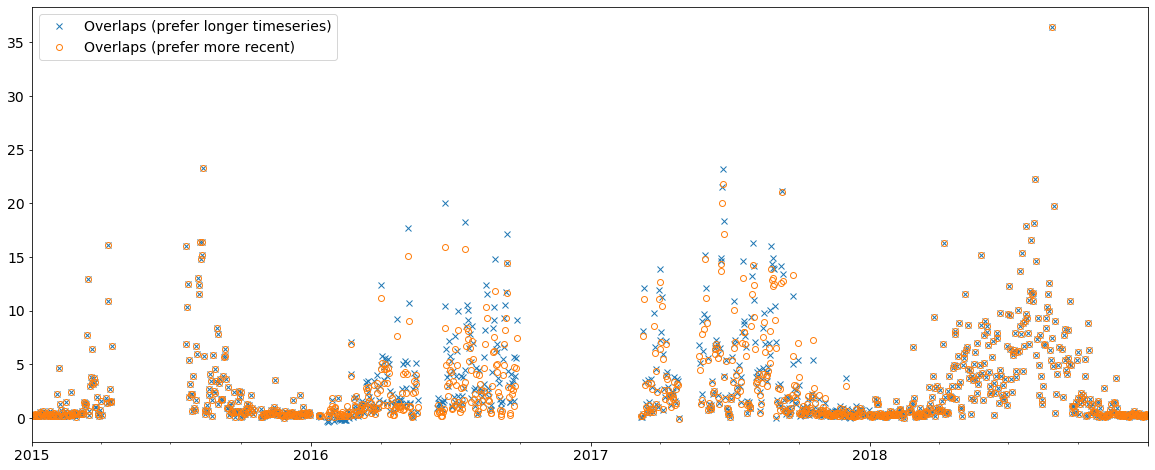
As you can see, the merging strategy can make an impact and it is important to define a reasonable strategy. In this case, it is certainly more reliable to use the data with the more recent revision date.
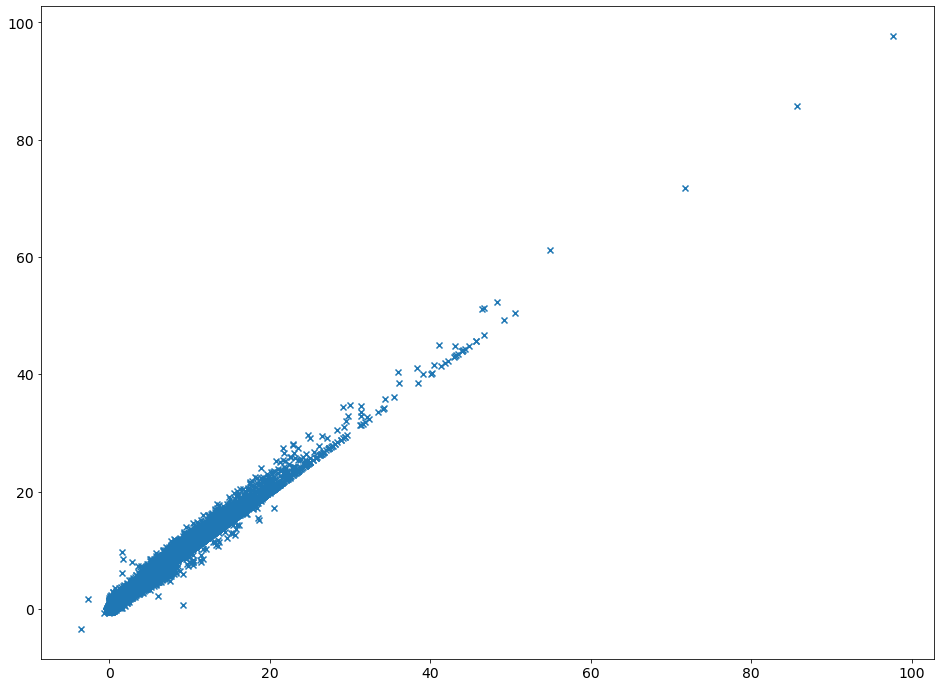
[22]:
import matplotlib.pyplot as plt

plt.figure(figsize=(16, 12))
ax = plt.scatter(merged_pref_recent_revision.overlap['scatc550aer'],
                 merged.overlap['scatc550aer'], marker='x')