About
pyaerocom is written and tested for python ≥ 3.10 and for unix based systems. It provides tools for processing and analyzing data as part of the AeroTools model evaluation project at the Norwegian Meteorological Institute, which services projects such as the Copernicus Atmosphere Monitoring Service, Copernicus Climate Change Service, EMEP, NorESM, and AeroCom.
The AeroTools project has the following mandate:
Support for projects delivering model evaluation results
User support for model-evaluation
Database management of observation data
Short and long-term development of evaluation tools, including web-pages showing evaluation results
The pyaerocom software is a core part of the AeroTools project and therefore it’s scope includes support for reading and processing of model data (e.g. AeroCom, EMEP, IFS), satellite data (e.g. TROPOMI, MODIS, AATSR) and ground based observation datasets (e.g. AERONET, EBAS, EARLINET, ICOS). In addition, pyaerocom provides tools for colocation and cross evaluation of different datasets using commonly used statistics including several biases, gross-errors, and correlation coefficients.
Main features
Reading routines for many ground based observation databases, such as:
AERONET Sun, SDA and Inversion products
Reading routines for level 3 gridded satellite observations, such as:
CALIPSO CALIOP Lidar observations
Data harmonization tools following the CF conventions.
Intuitive data objects for analysis of gridded data and ungridded (point-cloud) observations.
Sophisticated and flexible colocation routines for model evaluation and intercomparison of observations.
Interfaces for conversion of data to data types of related data analysis libraries such as pandas, numpy, xarray or iris.
Data visualization tools and interfaces to common plotting libraries such as matplotlib or cartopy.
Tools for statistical analysis of model performance.
Toolbox for analysis of trends in time-series.
Tools to compute ensemble averages from multiple model outputs.
High-level tools for automated analyses of multi-model and multi-obs inter-comparison studies.
Usage examples
Processing of data to display on AeroVal
Processing and harmonization of observations for Aerosol Trends interface.
pyaerocom was used for the model evaluation study by Gliß et al., 2020.
pyaerocom was used for the trends analysis by Mortier et al., 2020.
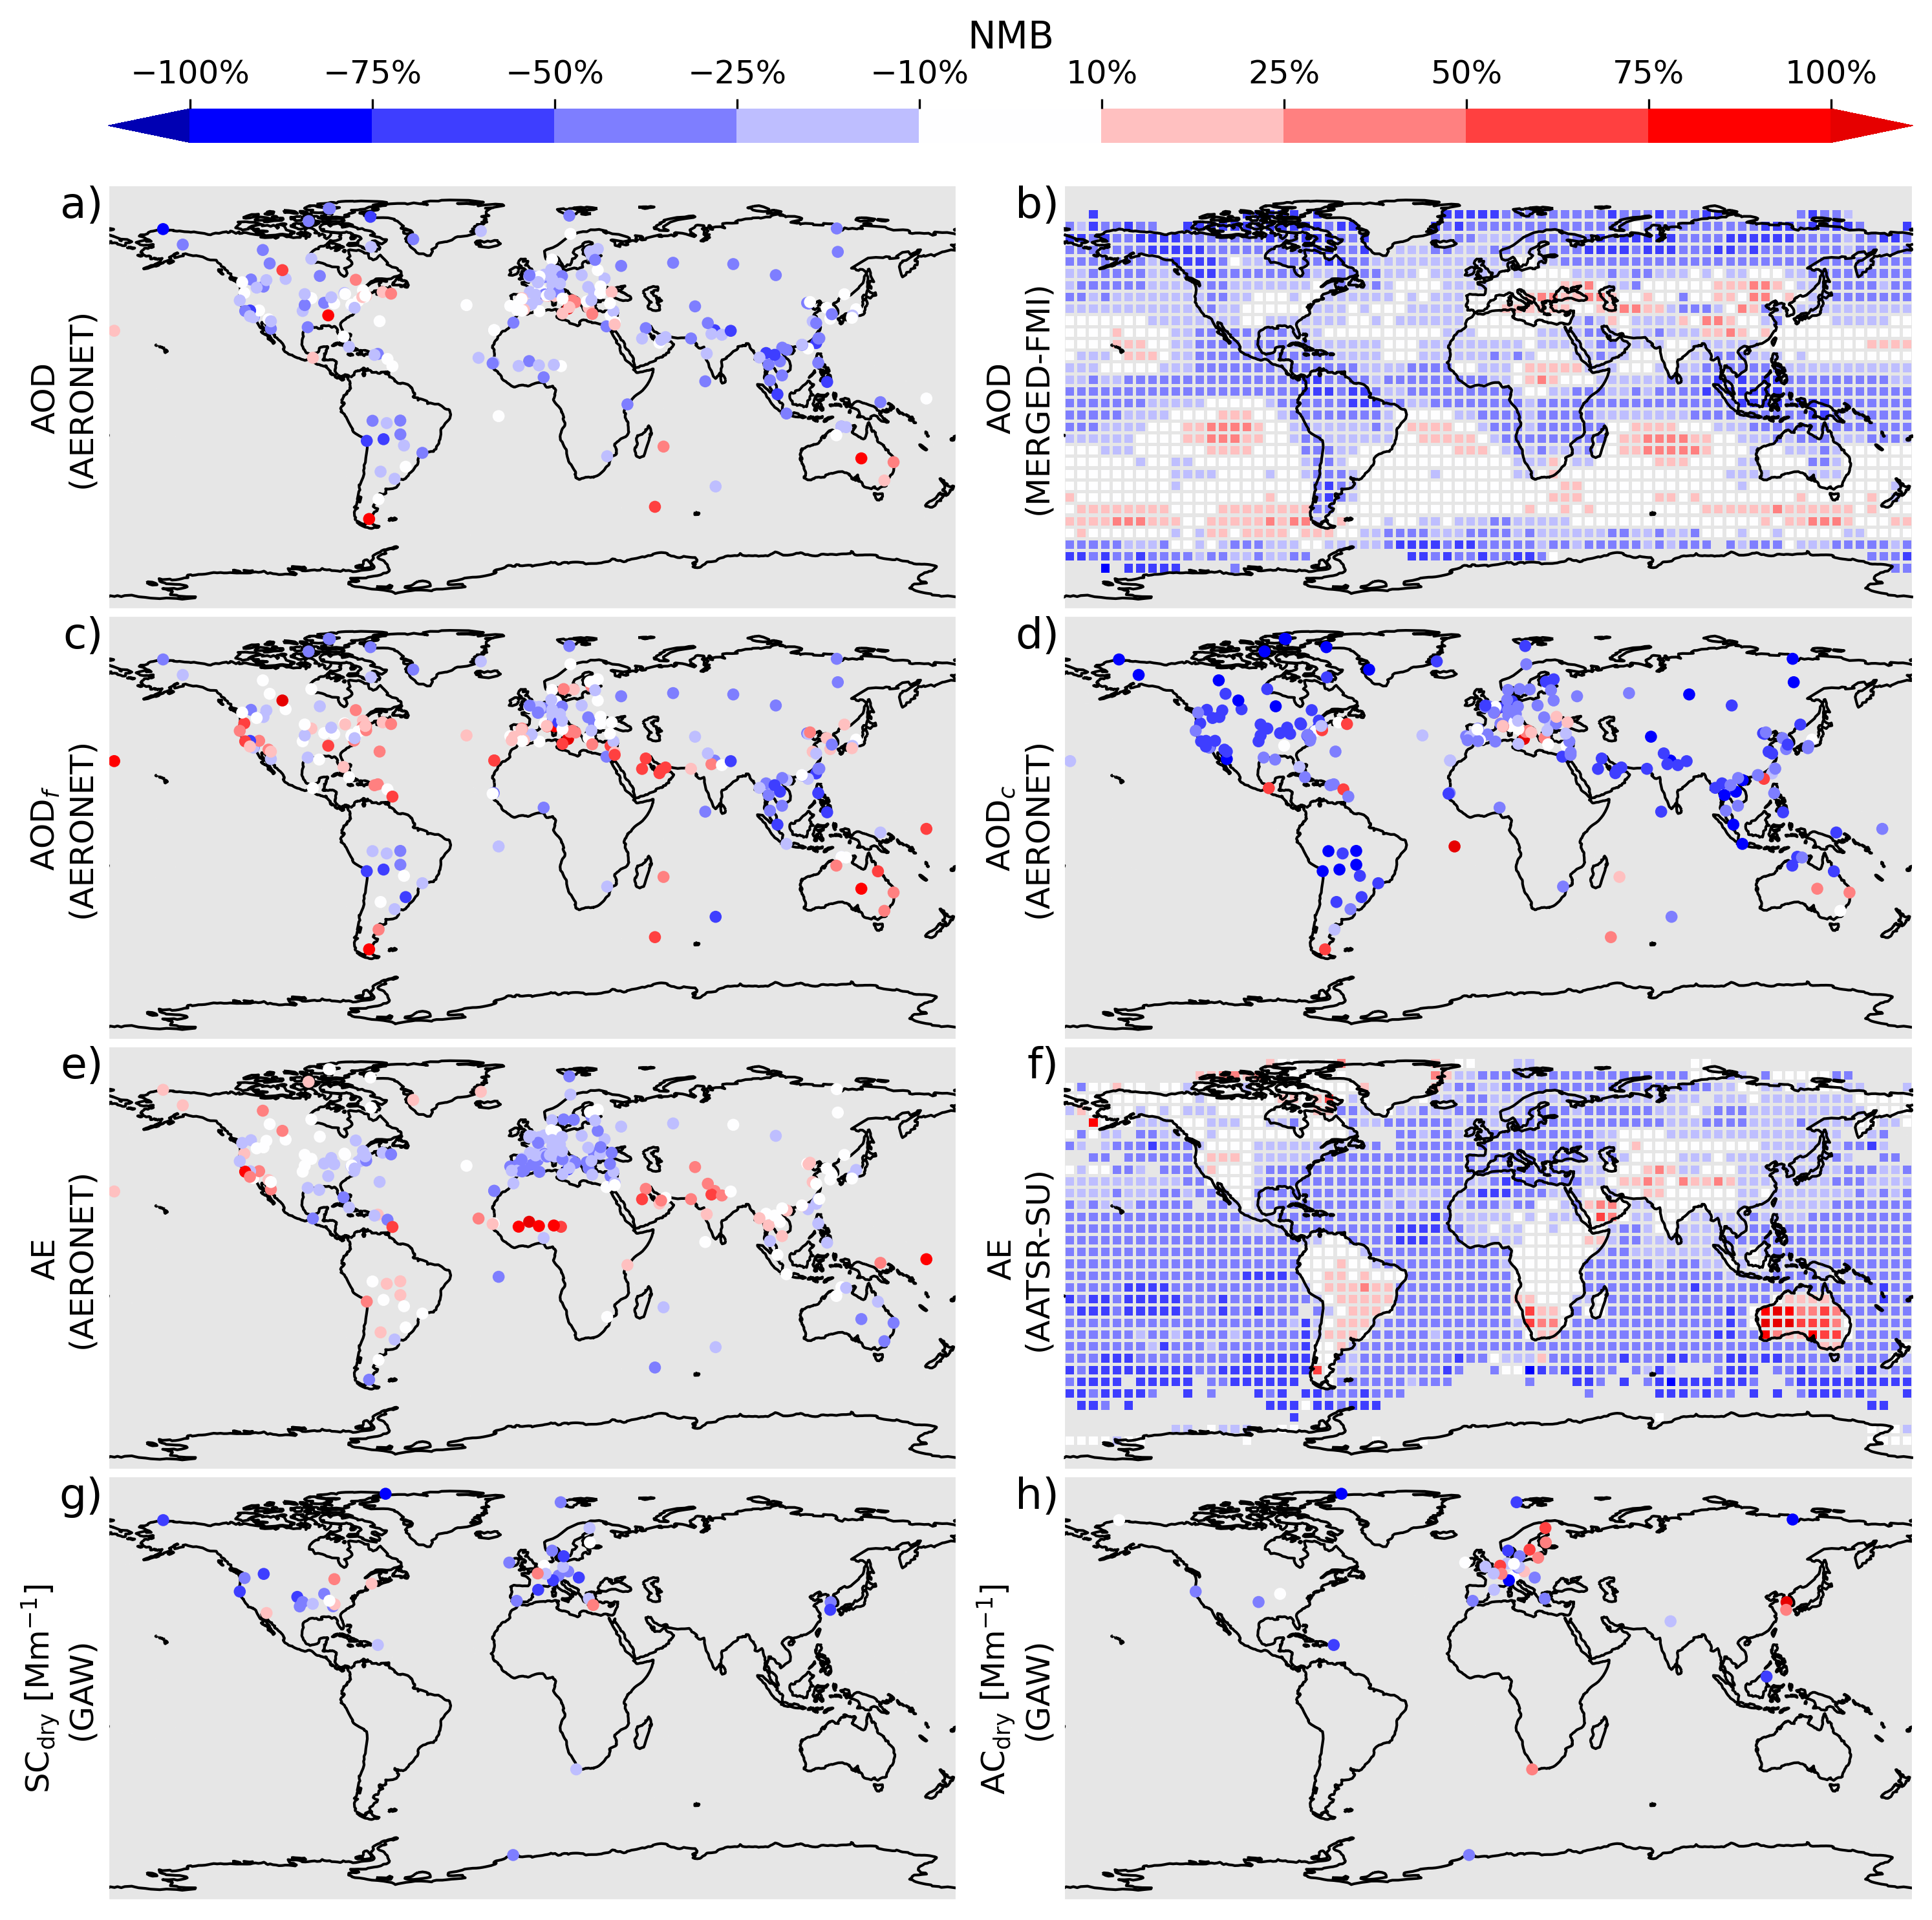
Bias maps of the AeroCom ensemble median compared to several observation records (Figure 5 from Gliß et al., 2021, processed with pyaerocom)
Access to AeroCom users database
The AeroCom users database hosted on the MET Norway servers contains model diagnostics from all AeroCom phases, ready for analysis.
If you wish to get access to the database, please follow the instructions provided in the following link:
https://wiki.met.no/aerocom/data_retrieval
NOTE: the users database does not contain any ground based observational data (such as EBAS, AERONET, etc.) but only the AeroCom model data available in the database as well as some gridded level 3 satellite data which may be used for model evaluation. Once you have access to the user database you may mount the file-system locally (e.g. via sshfs and register the data-paths you need in pyaerocom, for details see tutorials).
Remark for Windows users
pyaerocom is not tested on Windows systems and may only work in parts and thus some features may not work on Windows machines at the moment. Please let us know if you intend to use pyaerocom on a Windows machine so that we can consider adjusting our priorities, or also if you have any questions related to the usage.